
Twelve Years of Surveys: Comparing the 2014 and 2026 Community Visions
University Heights has always been a neighborhood of people who show up — residents who take real pride in our walkable, human-scale streets and who are not shy about saying what they want for them. Set the 2014 Community Improvement Survey beside our recent 2026 Community Development Survey (see details in the June UH News and online at www.uhsd.org/blog/26devsurveyresults), and a clear picture emerges: a community that has held fast to its core values while growing into a more sophisticated, more specific advocate for good planning.
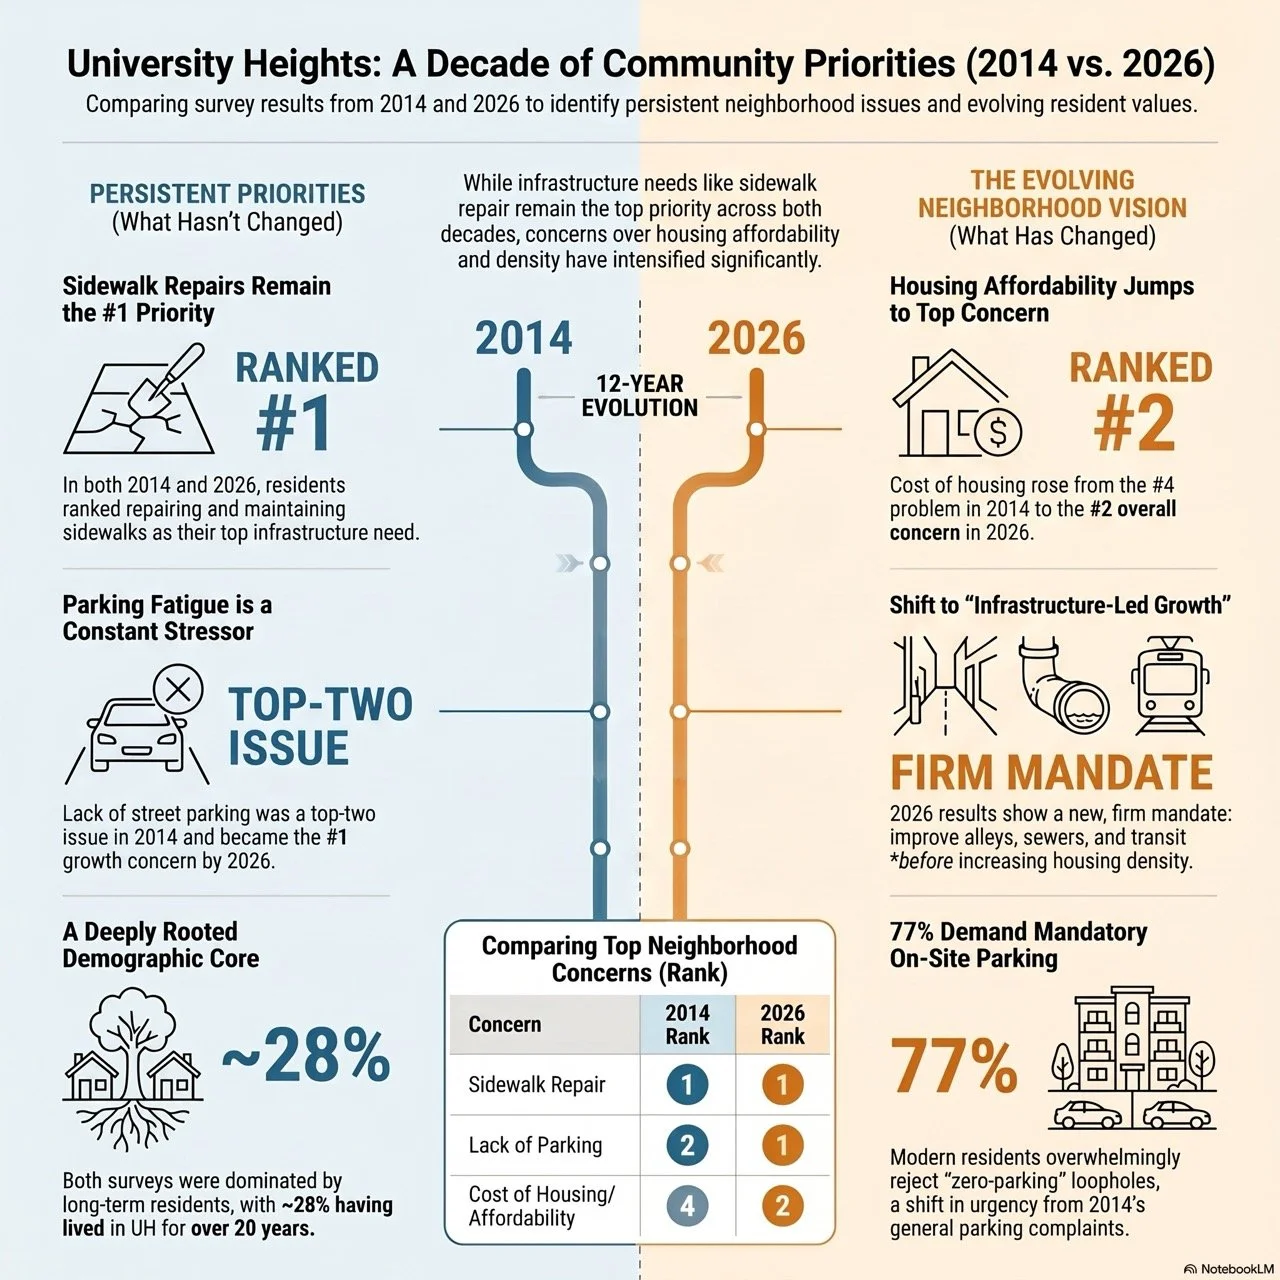
The Constants: Infrastructure Comes First
Basic maintenance remains the neighborhood's first demand across both surveys. In 2014, the top priority for tax-supported service improvements was repairing sidewalks, curbs, and gutters. Twelve years later, "repair and maintain sidewalks" still ranks as the highest infrastructure priority, with a scorecard score of 7.760. The case for street lighting has proved just as durable: the second-highest funding priority in 2014, it endures in 2026, when residents still describe residential blocks as "pitch black" and unsafe after dark.
From Naming Problems to Demanding Solutions
The 2014 survey dwelled on immediate nuisances — speeding, homelessness, parking. The 2026 results show a neighborhood that has moved from naming problems to prescribing solutions. Where parking was once simply flagged as a top problem, 77% of 2026 respondents now ask that new construction include at least one parking space per unit or bedroom. A clear vision for neighborhood scale has hardened, too: 65.3% of residents favor a strict 30-foot height limit on residential side streets to protect our bungalow scale.
The Affordability Paradox
The sharpest shift is around the cost of housing. In 2014, it ranked sixth among neighborhood problems; by 2026 it had climbed to the No. 2 concern overall. The reason is not hard to find. While San Diego rents fell 7.5% citywide in early 2026, the Uptown area held steady — and University Heights rents actually rose about 7% over the past year. It is a useful reminder that supply-side theory, whatever its merits in the aggregate, has not delivered relief here: new luxury construction has not lowered what our neighbors pay. That is why residents are, as one commented in their own words, "desperate" to protect Naturally Occurring Affordable Housing (NOAH), rating its importance at 6.63.
The Missing Voices
For all these clear mandates, both surveys carry the same caution: we are not yet hearing from everyone. Homeowners made up 59% of respondents in 2014 and 68.6% in 2026 — in a neighborhood where roughly 66% of residents are renters. The Community Coalition calls this a "friendly wake-up call," and it is the right phrase. An Action Matrix built on infrastructure-led growth and real affordability only carries weight if it reflects the whole neighborhood. The next step is the work University Heights has always done best: widening the circle, and making sure our renter majority is part of the conversation.
Authors' note: Google's NotebookLM AI tool was used to assist with the analysis of the raw survey data for both the 2014 and 2026 surveys. While the AI tool created the first draft of this summary article and the infographic, it was then checked for accuracy against the survey data, edited and expanded on by the author. The complete 2026 survey report including all questions, responses, and unaltered comments (without any personally identifiable information) is available at link.uhsd.org/26devsurveyresults and the full report for the 2014 survey is available at link.uhsd.org/14devsurveyresults.